Many new traders tend to confuse technical trading systems and technical analysis indicators. Although related, most of the confusion come from the utilization of technical analysis indicators within technical trading systems. Nonetheless, this article examines both.
Technical Analysis Indicators
A technical analysis indicator uses price and/or volume data to discern the trend of a market, the strength of market trends, where the market is heading, and where potential stalling or turning points may occur. There are many different types or technical analysis indicators, far too many to cover in this article. But, at a base level, technical analysis indicators can be quantified as an equation or algorithm. Some of the most popular technical analysis indicators are moving averages, momentum oscillators (like RSI, Stochastic, MACD, KasePO, and KaseCD), Bollinger bands, and the ADX.
Technical analysts base their trading decisions on the signal they receive from technical analysis indicators. The signals may indicate when to buy or sell a given security, where to place a stop, or when to exit a trade. Some indicators also give signals when a trade is setup, when the market is approaching support or resistance, or show the strength of the underlying market trend.
Technical Analysis Trading Systems
A technical trading system is formed by using a combination of the signals generated by technical analysis indicators. The system not only indicates when a trade should be entered but also exited. A well rounded technical analysis trading system will also manage a trade’s risk by placing stops, profit targets, and other methods of risk control. Thus, because a technical analysis trading system covers all aspects or trading (entry, exit, and risk management) they can be thoroughly back tested. In addition, a trading system can also be automated so that trades are automatically placed with the trader’s broker.
Kase StatWare®
One of the very reliable technical analysis trading indicator packages on the market today is Kase StatWare®. Kase’s state-of-the-art, market-timing studies condense signals into simplified, color-coded displays to fine tune entries, risk control and exits. Both traders and investors value Kase StatWare as it combines high accuracy with easy use and is compatible with all active stocks, commodities, futures, and indices. Also, Kase StatWare’s indicator signals can be used to create a trading system that can be back tested and automated.
Below is an overview of Kase StatWare’s core technical analysis indicators:
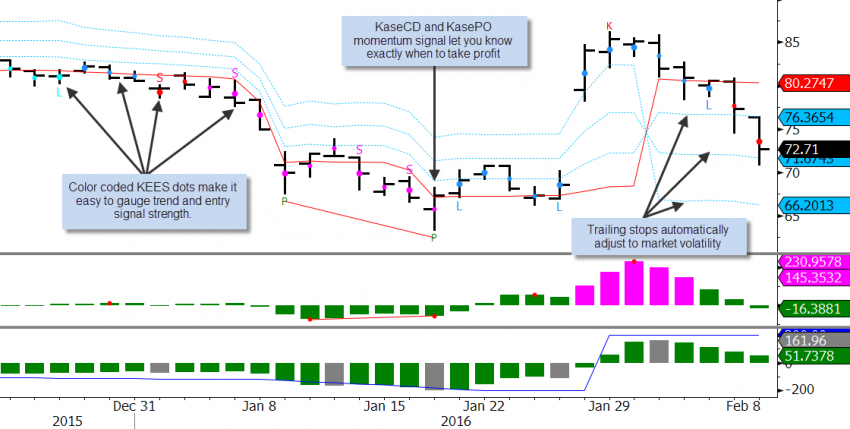
Color Coded Kase Easy Entry System (KEES)
Kase StatWare takes a range of entry signals including swings, momentum crossovers, bar patterns and a higher bar length filter and condenses them into an easy to use system of colored dots – blue shades for upward biased and red for downward – with “L” for long and “S” for short triggers. With the technology underlying KEES signals are confirmed 40% earlier than those using traditional methods.
Momentum Indicators: KasePO and KaseCD
Kase’s momentums studies – the acclaimed KasePO and KaseCD catch market turns 60% more accurately than optimized traditional indicators. The studies are based on Kase’s serial dependency index, which statistically measures the degree of non-random behavior, and self-optimizes both cycle length and volatility. Kase’s momentum divergence algorithm embedded in both studies automatically displays completed and confirmed divergences and pinpoints discrete overbought and oversold signals.
Rigorous Exit System: The DevStops
The ideal stop is one that best balances letting profits run while cutting losses. Kase’s famed DevStops evaluate not only average market range but distribution and variability of the range to set optimal stop/exit points statistical probabilities. Thus, DevStops are set at points at which there is an increasing probability of reversal against the trend being statistically significant.